8. Preprocessing Steps: Data Requirements and Preparation
8.1. Introduction
8.2. Database
The DTOcean tool is coupled to a Database which stores data that will be consumed by the tool.
The database is a relational Structured Query Language (SQL) database, using PostgreSQL version 9.4.
From a structural point of view is a unique entity, however it can be virtually portioned in two sub-set of meta-data Fig. 8.1:
- Reference data
- Project data
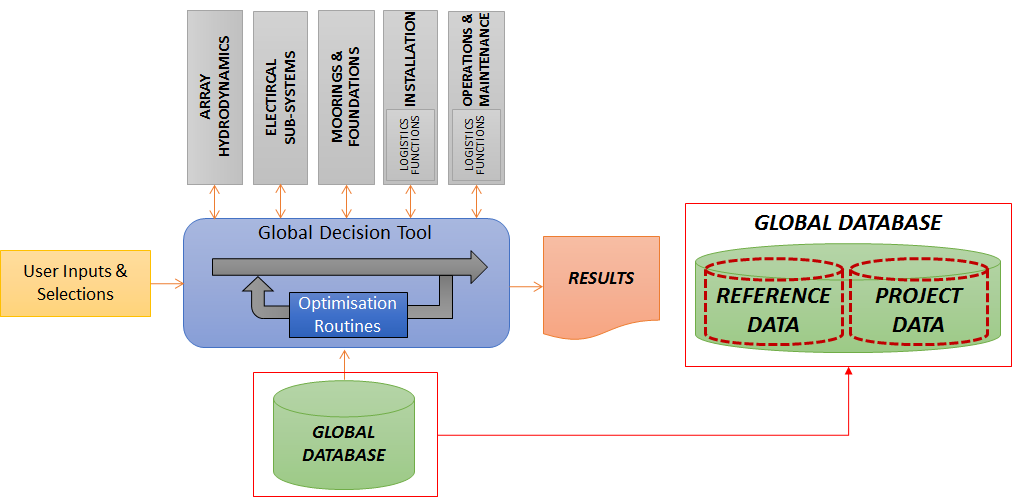
Fig. 8.1 Virtual partitioning of the Global Database
8.2.1. Reference data
Reference data is a long-standing set of data that can be called during the run of a simulation and also be consulted by the user as a catalogue of components.
In this regard the data thereafter described is made fully searchable.
Broadly speaking Reference data includes:
- Electrical components
- Mooring/Foundations components
- Vessels
- Ports
Electrical components related Database tables contain detailed information of a large spectrum of components required in order for the tool to make an informed choice that is reflected in the simulation. These are:
- Cables (static and dynamic)
- Connectors (wet and dry)
- Transformers (Power, OEC, Auxiliary, Grounding and Measurements)
- Switchgears (Circuit breakers, fuses, relays and Disconnectors)
- Ancillary (Junction boxes, Back-up Generators and Bus-Bars)
- Collection points (Hubs and Substations)
- Power quality (Reactive compensations, Harmonic filters and FACTS)
Likewise, mooring components include:
- Chains
- Anchors
- Shackles
- Ropes
- Forerunners
- Swivels
- Piles (foundations for fixed devices)
A list of vessels with relative characteristics is provided as well.
The tool will select from the list the Vessels which characteristics suffice to carry out installation with respect to minimum CaPEX.
A list of Ports along the European cost is made available and is used by the tool in order to optimise Installation and O&M operations.
Reference value are common for both Wave and Tidal project.
All data so far described can be used as reference, hence the user will be able to override the tool decision of using reference data by entering his/her own values should be a different component/vessel/port be available.
As previously mentioned, all data above described are made available in a text-based searchable files (ANNEXXX).
These files can all be easily read by any user with no experience with Database design, exception made for table “primary keys” (i.e. id) and “foreign key” (i.e. fk_id). These identifiers are necessary to identify relationship between parent and child tables.
The functionality to display all attributes belonging to any reference data item across parent and child tables happens a GUI level as per Database design industry standard and therefore, out of scope of this section.
The user is invited to refer back to “Technical Manual” in order to gain an insight into the structure of the Database and tables relationship.
8.2.2. Project data
Project data are set of data that the end user is required to enter in order to run a simulation.
This data is of course specific to a project and will change location to location.
This encompasses data relative to the device, bathymetry of the site, metocean characteristics, geotechnical description of the soils and a number of physical characteristics unique to the site of interest.
Three different mechanism are available for the user to feed data to the DTOcean tool:
- Feed data directly to the Core through the GUI
- Populate the Database by means of ad-hoc SQL scripts
- Populate the Database using Database management system
All three options require some pre-processing on the data as per any state-of-art software.
Option 2 and 3 require the user to have SQL and Database programming skills. An overview will be given in the “Technical manual”.
Option 1 is described in the GUI section.
The Database is designed following the specific requirements (i.e. input) from each single module.
The full description of modules input is described in the specific section.
A set of project dummy data is also provided for both Wave and Tidal project and are available in the Database. The user will have full access to this in order to familiarise with the structure of the Database and its content.
8.2.3. Dummy data
The Database is pre-populated with Project dummy data (in addition to the long-standing reference data) in order for the end User to familiarise with the tool.
The dummy data covers one Wave and Tidal scenario. Only data relative to WP2,3 and 4 are present in the DB. These are the three modules which the Core can connect to.
The following main set of data are briefly described:
- Bathymetry of the Lease Area
- Bathymetry of Cable Corridor
- Geotechnical characteristics of the Lease Area
- Geotechnical characteristics of Cable Corridor
- Metocean Data
- Wave Device
The remaining values for meta-data in the Database are not described in this section since they are self-explanatory and are described in details in each WP section.
Nonetheless, they are provided in the Database in order to allow the user to run a full simulation.
8.2.4. Wave Scenario
Bathymetry of the Lease area
The bathymetry data have been downloaded from the publicly available data page on the Scottish Government website. As reference, the Shetland bathymetry has been chosen (http://www.gov.scot/Topics/marine/science/MSInteractive/datatype/Bathymetry/data/shetlandbathymetry). The original resolution of the Bathymetry is 3m, but in order to provide a set of data that contains a limited number of point (i.e. for ease of computational time) the bathymetry has been resampled at 12m.
A rectangular shaped Lease Area is chosen in order to contain 100000 (i.e. 500 x 200 points ) bathymetry points.
The coordinates of the polygon identifying the lease area are shown below:

The Area in question is shown in red in Fig. 8.2:
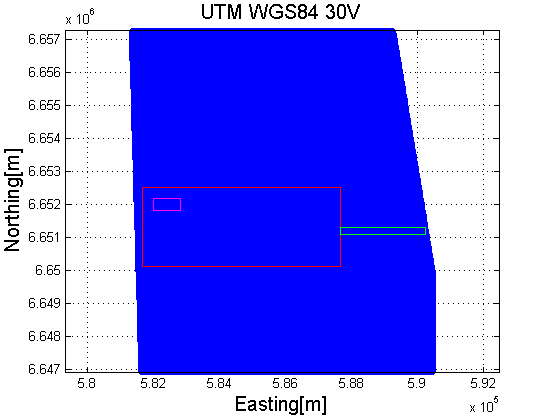
Fig. 8.2 Lease Area in red, Cable Corridor in green and a generic Constrained Area in magenta
Bathymetry of Cable corridor
In accordance to what described above for the Lease Area bathymetry also a Cable Corridor has been identified.
The coordinates of the polygon are:

The cable corridor is shown in green in Fig. 8.2 and it is made of 2300 points (i.e. 215 x 20 points) at 12m resolution.
Geotechnical characteristics of the Lease area
The Database offer the functionality to store geotechnical information for each single point of the domain (i.e. Lease Area and Cable Corridor). To each bathymetry point one or more layers can be assigned. Each layer represents a soil type that in turn is fully characterized by specific geotechnical characteristics as described in WP4 section.
As dummy data, a simple scenario of two parallel layers made of “mediumsand” and “softclay” has been created. The characterization of the Lease Area can be found in the Fig. 8.3 below:

Fig. 8.3 Lease Area in red, Cable Corridor in green and a generic Constrained Area in magenta
Geotechnical characteristics of Cable Corridor
The Cable Corridor geotechnical characterization follows the same logics as the one for the Lease Area.
However, different soil type and relative layer thickness have been applied (Fig. 8.4).

Fig. 8.4 Lease Area in red, Cable Corridor in green and a generic Constrained Area in magenta
Metocean data
For a Wave scenario, the DTOcean toll requires a set of data which describes the wave resource of the site.
Different meta-data are required from different WPs in order to run their modules. The specific requirement of it are specified in each single WP section.
The Table below gives an overview of the type of data contained in the DB:

Fig. 8.5 Overview of the wave resource time series
Two years of wave resource time series at hourly resolution is provided for the following variables:
Hs: Significant Wave Height [m]
Tp: Peak Period [s]
Te: Energy Period [s]
Tz: Zero up-crossing period [s]
Dir : mean Direction
The wave rose of the dummy Wave time series of Hs and Dir is shown in Fig. 8.6:
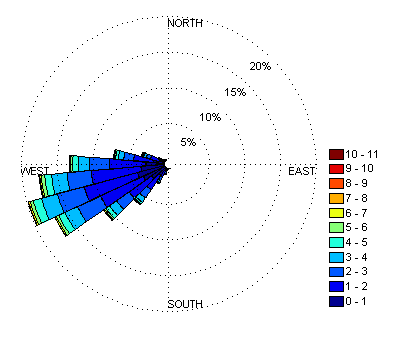
Fig. 8.6 Wave rose of Hs and Dir relative to wave resource time series
Wave device
The Database cointains data regarding a simple heaving cylinder rated at 480KW.
The main characteristics of the device can be seen in Fig. 8.7 and Fig. 8.8.
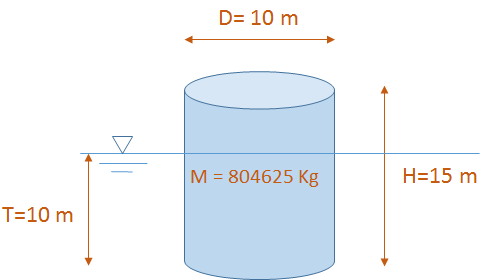
Fig. 8.7 Main device dimensions
H (Device Height) = 15m
D (Device Diameter) = 10m
T (Device Draft) = 10 m
M (Device Mass) = 804625 Kg
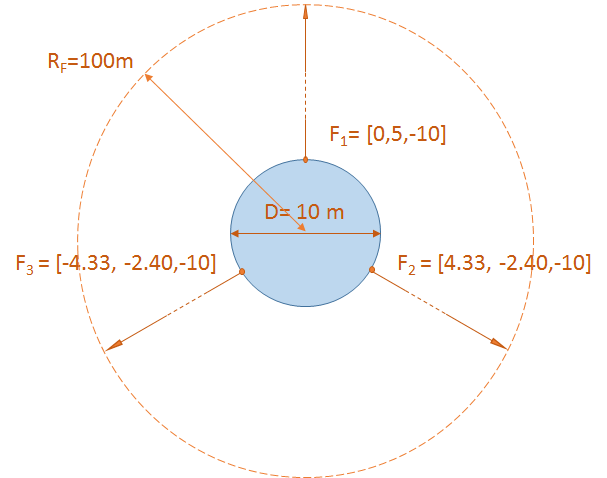
Fig. 8.8 Device top view
RF (Footprint Radius) = 100 m
Fi (i-th Fairlead location) = F1:[0,5,-10]; F2:[4.33, -2.40,-10]; F3:[-4.33, -2.40,-10]
In order to proceed with hydrodynamics simulation (WP2 module), input files to Nemoh have been generated and can be found in a folder which content is shown below in Fig. 8.9.
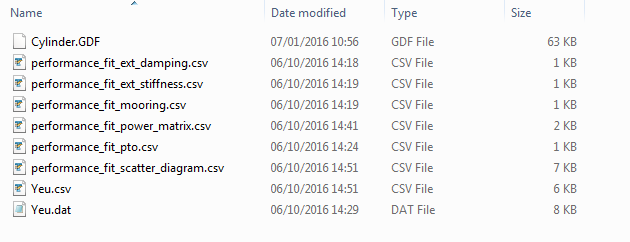
Fig. 8.9 Input files to Nemoh in the dummy data device folder
8.2.5. Tidal Scenario
Bathymetry of the Lease area
The same Lease Area as the dummy Wave scenario previously described has been used (Fig. 8.2).
The domain is made up of 100000 points (500 x 200 points at 12m resolution).
Bathymetry of Cable corridor
Similarly, The same Cable Corridor as the dummy Wave scenario previously described has been used (Fig. 8.2).
The domain is made up of 4300 points (215 x 20 points at 12m resolution).
Geotechnical characteristics of the Lease area
The same characterization of the Lease Area as the dummy Wave scenario in terms of layers, soil types and geotechnical characteristics is used.
The schematic overview can be found in Fig. 8.3.
Geotechnical characteristics of Cable Corridor
The same characterization of the Cable Corridor as the dummy Wave Scenario in terms of layers, soil types and geotechnical characteristics is used.
The schematic overview can be found in Fig. 8.4.
Metocean data
Timeseries of tidal stream are provided for all points of the domain (i.e. Lease area and Cable Corridor).
An example of typical tidal stream data is shown in Fig. 8.10:

Fig. 8.10 Tidal stream time series example
The time series cover a time span of two years at hourly resolution.
u: x-axis component of the tidal stream flow [m/s]
v: y-axis component of the tidal stream flow [m/s]
Water Level: Sea surface level w.r.t MSWL [m]
TI : Turbulence intensity
Tidal device
Data regarding a single turbine device rated at 1MW and founded on a mono-pile has been generated and made available in the Database.
The main characteristics of the device can be seen in Fig. 8.11.
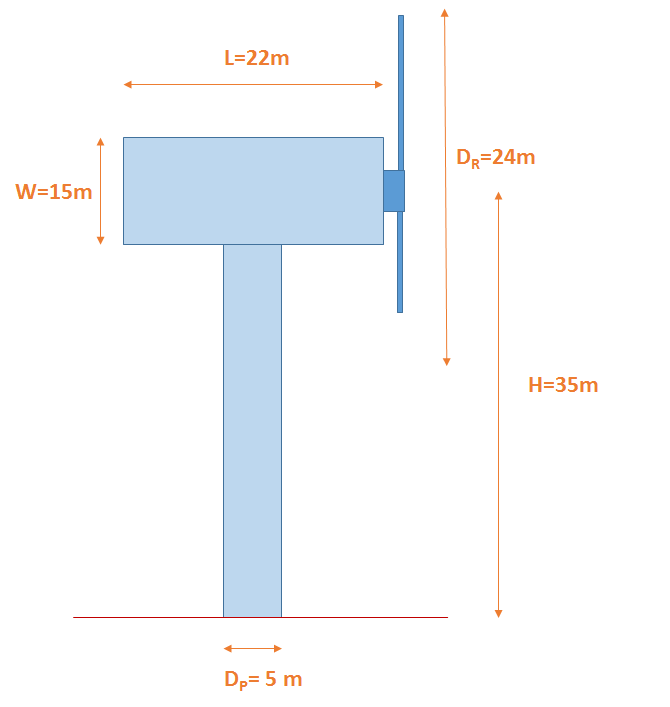
Fig. 8.11 Main characteristics of the dummy tidal device
H (Hub Height) = 35m
DR (RotorDiameter) = 24m
L (Device Length)= 22m
W (Device Width)= 15m
DP (Pil Diameter) = 5m
M (System Mass)= 305000 kg
A dummy power curve and Thrust coefficient curve have been generated as shown in Fig. 8.12.

Fig. 8.12 Power curve and Thrust coefficient
Cut-in and Cut-out velocity corresponds respectively to 0.72m/s and 3.60 m/s tidal stream velocity.